2Fundamentals of Analytics Intelligence and Machine Learning
2.1Algorithm
Algorithm
An algorithm is a set of defined instructions or rules designed to solve a specific problem or perform a computation.
In the context of analytics, intelligence, and machine learning, algorithms form the backbone of data-driven processes, enabling machines to learn patterns, make decisions, and optimize outcomes. Algorithms are implemented using programming languages and work on data to provide actionable insights.
2.1.1 Key Characteristics of an Algorithm:
Finite Steps: Algorithms must have a clear beginning and end.
Input: Takes data as input for processing.
Output: Produces a result or solution based on the input.
Deterministic or Probabilistic: Some algorithms give the same output for the same input (deterministic), while others provide variable outputs based on probabilities.
Efficiency: Optimized algorithms minimize computational costs in terms of time and resources.
2.1.2 Types of Algorithms in Analytics and Machine Learning
Sorting and Searching Algorithms
These algorithms organize and retrieve data efficiently.
Example: Quick Sort, Binary Search.
Application: Used in database systems for sorting data and retrieving customer information quickly.
Regression Algorithms
Identify relationships between variables and predict continuous outcomes.
Example: Linear Regression, Polynomial Regression.
Application: Predicting crop yield based on soil quality and rainfall data in agribusiness.
Classification Algorithms
Categorize data into predefined labels.
Example: Logistic Regression, Support Vector Machines.
Application: Classifying customers into different segments for targeted marketing.
Clustering Algorithms
Group data points into clusters based on similarity.
Example: K-Means, Hierarchical Clustering.
Application: Identifying regions with similar soil quality for efficient resource allocation in agriculture.
Optimization Algorithms
Solve problems by maximizing or minimizing specific parameters.
Example: Gradient Descent, Genetic Algorithms.
Application: Optimizing fertilizer use to reduce costs and environmental impact.
Decision Tree-Based Algorithms
Use tree-like structures to make decisions.
Example: Random Forest, Gradient Boosting.
Application: Determining the best pricing strategy for a product based on historical sales data.
2.1.3 Importance of Algorithms in Machine Learning
Foundation for Learning Models: Algorithms train machine learning models to recognize patterns and make predictions.
Efficiency: Enable efficient data analysis, even with large datasets.
Adaptability: Many algorithms can adapt to changing data patterns, ensuring their relevance over time.
2.1.4 Examples of Algorithm Application in Real-World Scenarios
Agribusiness:
Algorithm: K-Means Clustering.
Use Case: Grouping fields based on soil properties for tailored crop recommendations.
Retail:
Algorithm: Apriori Algorithm.
Use Case: Recommending products to customers based on purchase history.
Healthcare:
Algorithm: Logistic Regression.
Use Case: Predicting the likelihood of a patient developing a disease based on health metrics.
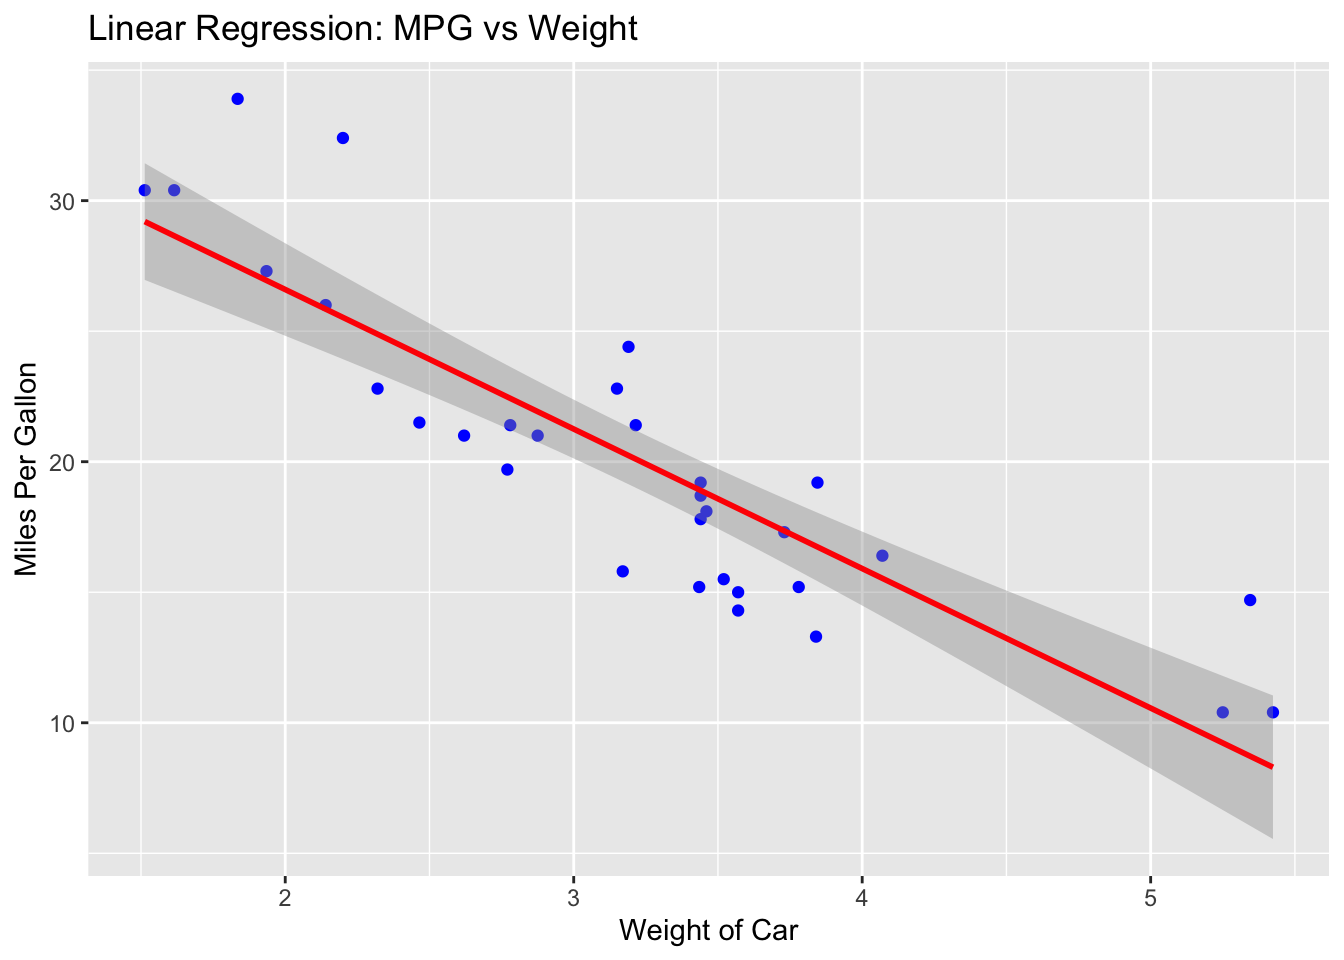
Algorithm Explanation: Linear regression finds the relationship between an independent variable X and a dependent variable Y by fitting a line that minimizes the sum of squared differences between observed and predicted values.
Dataset: Use the built-in mtcars dataset in R.
Code
# Install required packages if not already installedinstall.packages("tidyverse")
Code
# Load the librarylibrary(tidyverse)# Load the datasetdata(mtcars)# View the first few rowshead(mtcars)
# Fit a linear regression modelmodel<-lm(mpg~wt, data =mtcars)# Summary of the modelsummary(model)
Call:
lm(formula = mpg ~ wt, data = mtcars)

Residuals:
    Min      1Q  Median      3Q     Max
-4.5432 -2.3647 -0.1252  1.4096  6.8727

Coefficients:
            Estimate Std. Error t value Pr(>|t|)
(Intercept)  37.2851     1.8776  19.858  < 2e-16 ***
wt           -5.3445     0.5591  -9.559 1.29e-10 ***
---
Signif. codes:  0 '***' 0.001 '**' 0.01 '*' 0.05 '.' 0.1 ' ' 1

Residual standard error: 3.046 on 30 degrees of freedom
Multiple R-squared:  0.7528,    Adjusted R-squared:  0.7446
F-statistic: 91.38 on 1 and 30 DF,  p-value: 1.294e-10
Code
# Visualize the regression lineggplot(mtcars, aes(x =wt, y =mpg))+geom_point(color ="blue")+geom_smooth(method ="lm", color ="red")+labs(title ="Linear Regression: MPG vs Weight", x ="Weight of Car", y ="Miles Per Gallon")
2.2Big Data
Big Data refers to massive, complex, and high-velocity datasets that traditional data processing systems are unable to handle effectively. These datasets are characterized by their vast size and require advanced tools, algorithms, and storage mechanisms for processing and analysis. Big Data plays a transformative role in analytics, intelligence, and machine learning by enabling insights that were previously unattainable.
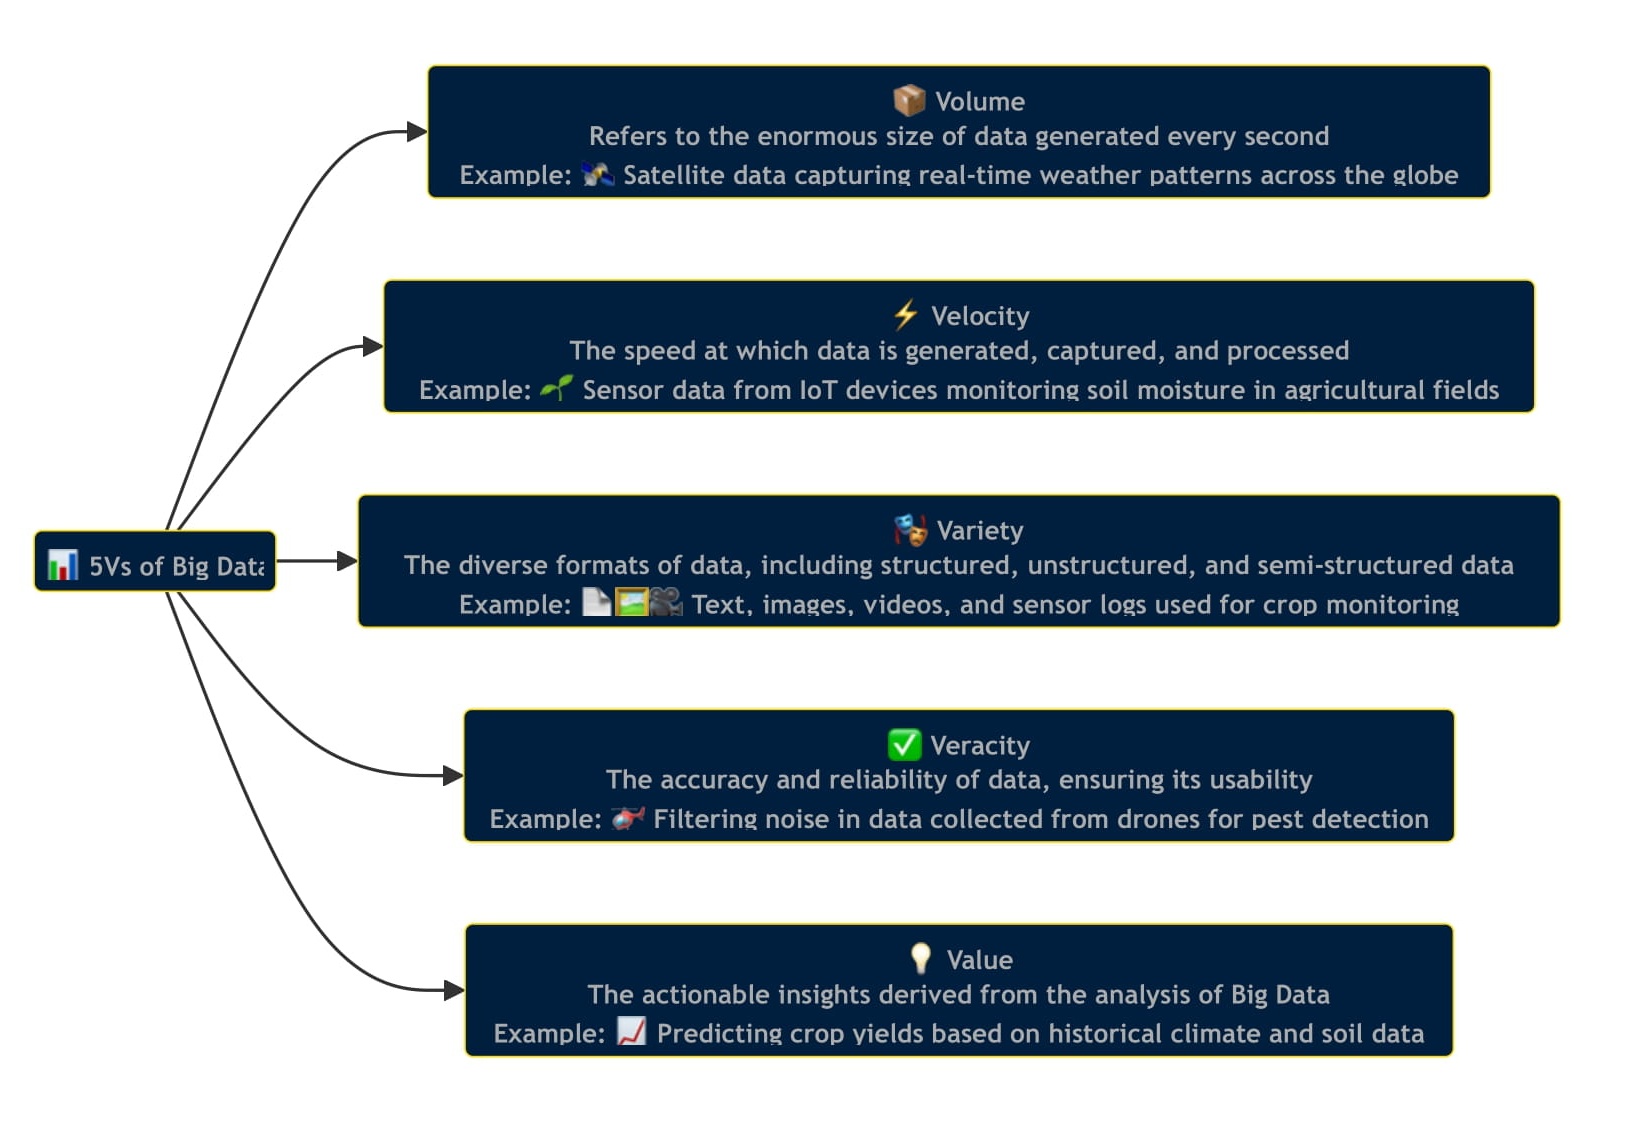
2.2.1 Characteristics of Big Data (The 5 Vs)
1. Volume: Refers to the enormous size of data generated every second.
- Example: Satellite data capturing real-time weather patterns across the globe.
Velocity: The speed at which data is generated, captured, and processed.
Example: Sensor data from IoT devices monitoring soil moisture in agricultural fields.
Variety: The diverse formats of data, including structured, unstructured, and semi-structured data.
Example: Text, images, videos, and sensor logs used for crop monitoring.
Veracity: The accuracy and reliability of data, ensuring its usability.
Example: Filtering noise in data collected from drones for pest detection.
Value: The actionable insights derived from the analysis of Big Data.
Example: Predicting crop yields based on historical climate and soil data.
2.2.2 Applications of Big Data in Machine Learning
Training Models: Big Data serves as the fuel for training machine learning models, improving their accuracy and reliability.
Predictive Analysis: Uses historical data to predict future trends, such as market demand or disease outbreaks.
Real-Time Processing: Supports applications that require immediate data processing, such as fraud detection systems.
2.2.3 Tools and Technologies for Big Data
Storage and Management:
Hadoop: A distributed storage and processing system for large datasets.
Amazon S3: Cloud storage service for scalable and secure data storage.
Processing and Analysis:
Apache Spark: A fast data processing engine for real-time analytics.
SQL Databases: Used for structured data analysis.
Visualization:
Tableau: Creates interactive dashboards to visualize trends in Big Data.
Power BI: Provides insights through graphical representations.
2.2.4 Examples of Big Data Applications
Agribusiness:
Use Case: Monitoring crop health using data from satellites, drones, and IoT sensors.
Technology: Hadoop and Spark for processing real-time data from multiple sources.
Healthcare:
Use Case: Analyzing patient records to identify patterns for early disease detection.
Technology: Big Data platforms like Cloudera for patient data management.
Retail:
Use Case: Understanding customer preferences by analyzing purchase history and online behavior.
Technology: Spark for processing large volumes of e-commerce transaction data.
Transportation:
Use Case: Optimizing logistics and supply chain routes using GPS and sensor data.
Technology: Real-time data pipelines in Apache Kafka for route optimization.
2.3Business Analytics
Data Analytics
Analytics is defined as “the scientific process of transforming data into insights for making better decisions”.
Analytics, is the use of data, information technology, statistical analysis, quantitative methods, and mathematical or computer-based models to help managers gain improved insight about their business operations and make better, fact-based decisions – James Evans.
Business Analytics
Business Analytics (BA) refers to the practice of methodical exploration of an organization’s data, with an emphasis on statistical analysis. It is used by companies committed to data-driven decision-making to gain insights from their data. Business Analytics is often used interchangeably with business intelligence.
The primary goal of Business Analytics is to analyze and understand past business performance and make informed predictions about future actions. It involves the use of various quantitative methods, statistical analysis, predictive modeling, and data visualization tools to analyze and transform data into actionable insights.
2.3.1 Data Analytics and components
Data Analytics is the process of examining, cleaning, transforming, and modeling data with the objective of discovering useful information, informing conclusions, and supporting decision-making. - It’s a multifaceted field that combines theories and techniques from different disciplines like mathematics, statistics, computer science, and information technology.
Key Components of Data Analytics
Data Collection: Gathering raw data from various sources such as databases, files, external services, or sensors.
Data Cleaning: Identifying and correcting errors or inconsistencies in data to improve its quality.
Data Analysis: Using statistical techniques and software to explore data, find patterns, relationships, or trends.
Data Interpretation: Making sense of the analyzed data to draw meaningful conclusions.
Data Visualization: Presenting data in graphical forms like charts, graphs, and dashboards for easier interpretation.
Data Analytics Process
2.3.2 Data Analytics Tools and Technologies
Programming Languages:
Python: Widely used due to its simplicity and powerful libraries like Pandas, NumPy, Scikit-learn, TensorFlow, and Matplotlib.
R: Preferred for statistical analysis and data visualization, with packages like ggplot2, dplyr, shiny, and caret.
SQL: Essential for database querying and management.
Data Visualization Tools:
Tableau: Known for its user-friendly interface and powerful data visualization capabilities.
Microsoft Power BI: Integrates well with other Microsoft products, offering robust visualization and business intelligence features.
Data Warehousing and Database Management:
MySQL, PostgreSQL: Popular relational database management systems.
MongoDB: A leading NoSQL database for working with large-scale unstructured data
Amazon Redshift, Google BigQuery: Cloud-based data warehousing solutions that allow for the storage and analysis of big data.
Big Data Technologies:
Apache Hadoop: A framework that enables distributed storage and processing of large data sets.
Apache Spark: Known for its speed and ease of use in handling big data analytics.
Business Intelligence (BI) Tools:
SAS: Offers a range of statistical, predictive, and descriptive analysis capabilities.
IBM Cognos: Provides business intelligence and performance management solutions.
Google Looker Studio: A business intelligence software and big data analytics platform.
Machine Learning Platforms:
TensorFlow, PyTorch: Libraries for machine learning and deep learning.
RapidMiner: Data science platform that provides an integrated environment for data preparation, machine learning, deep learning, text mining, and predictive analytics.
Google AI Platform, AWS Machine Learning:
Cloud-based platforms offering machine learning services and tools.
Data Integration Tools:
Talend, Informatica: Tools used for data integration, data quality, and data management.
Apache Kafka: Used for building real-time data pipelines and streaming apps.
Cloud Platforms:
AWS, Google Cloud Platform, Microsoft Azure: Offer a wide range of services for data analytics, including storage, machine learning, and big data processing.
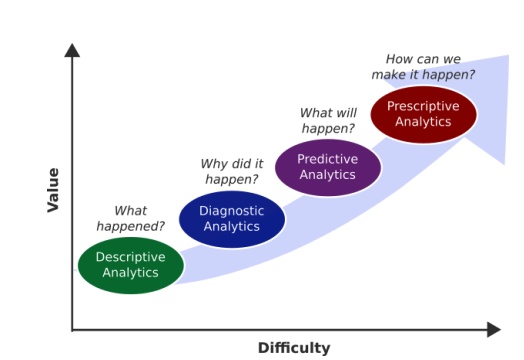
2.3.3 Types of Business Analytics
Business analytics can be divided into several types, each addressing different kinds of decision-making needs and business processes. Here are the primary types of business analytics:
Types of Business Analytics
Type
Description
Key Features
Examples
Descriptive
Focuses on describing or summarizing past data to understand what has happened in the business.
- Uses data aggregation and data mining techniques. - Provides insights into past performance.
- Sales reports - Customer churn rates
Diagnostic
Examines past performance to determine the causes of past success or failure.
- Involves data discovery, correlations, and drill-downs. - Answers “why did it happen?”
- Root cause analysis - Performance discrepancies analysis
Predictive
Uses statistical models and forecasts techniques to understand the future.
- Employs statistical algorithms and machine learning. - Predicts future trends and outcomes.
- Market trends forecasting - Demand prediction
Prescriptive
Suggests actions you can take to affect desired outcomes.
- Combines insights from all other analytics. - Recommends decisions using optimization and simulation algorithms.
Mimics human brain function to improve decision-making.
- Utilizes artificial intelligence and machine learning. - Enhances human decision-making with insights from data analysis and pattern recognition.
- Chatbots for customer service - Personalized marketing
Classification of Business Analytics
source:
2.3.4 Descriptive Analytics
Descriptive analytics is the examination of historical data to understand changes that have occurred in a business.
By analyzing past events and performances, descriptive analytics helps organizations understand the reasons behind success or failure, identify trends, and make informed decisions. It is often considered the first step in the broader field of business analytics, laying the groundwork for more advanced predictive and prescriptive analysis.
Key Components of Descriptive Analytics
Data Aggregation and Summarization: Gathering and consolidating data from various sources to provide a coherent overview. This includes compiling reports, dashboards, and visualizations that represent complex datasets in an accessible format.
Data Mining: Exploring large datasets to find patterns, correlations, and insights. This involves techniques such as clustering, classification, and association analysis to uncover hidden patterns in data.
Trend Analysis: Identifying consistent patterns or trends over time. This can involve moving averages, time-series analysis, and seasonal decomposition to understand temporal changes and cyclic patterns.
Visualization: Presenting data in graphical formats, such as charts, graphs, and heat maps, to help stakeholders quickly grasp the insights contained in the data. Effective visualization is crucial for communicating findings and supporting decision-making processes.
Applications of Descriptive Analytics
Descriptive analytics finds applications across all sectors of business, helping organizations to measure, track, and optimize their operations and strategies. Here are some key applications:
Performance Metrics and Benchmarking: Businesses use descriptive analytics to track performance metrics such as sales revenue, customer acquisition costs, and operational efficiency. By comparing these metrics against industry benchmarks, companies can gauge their performance and identify areas for improvement.
Financial Analysis: Organizations employ descriptive analytics to manage their financial health by analyzing income statements, balance sheets, and cash flow statements. This analysis helps in understanding revenue streams, expenses, profitability, and liquidity positions.
Customer Behavior Analysis: By examining past purchasing behaviors, preferences, and interactions, companies can better understand their customers. This insight is critical for improving customer service, tailoring marketing strategies, and enhancing customer retention.
Inventory Management: Descriptive analytics aids in optimizing inventory levels by analyzing historical sales data, seasonality, and trends. This enables businesses to reduce carrying costs, minimize stockouts, and improve order fulfillment.
Supply Chain Management: Analyzing historical data related to supply chain operations helps businesses identify bottlenecks, evaluate supplier performance, and optimize logistics. This leads to more efficient supply chain operations and cost reductions.
2.3.5 Diagnostic Analytics
Diagnostic analytics takes a step further from descriptive analytics by not just describing what has happened in the past, but also attempting to understand why it happened.
It involves drilling down into your data, discovering patterns, identifying anomalies, and investigating the causes behind observed events or behaviors. Diagnostic analytics is essentially about finding relationships among data points and determining the factors that contribute to a particular outcome.
How Diagnostic Analytics Works
The process typically involves the following steps:
Data Collection and Preparation: Gathering comprehensive data from various sources and ensuring it’s cleaned and formatted for analysis.
Identification of Anomalies: Using techniques to identify deviations from the norm, which could indicate issues or opportunities for further investigation.
Drill-Down Analysis: Delving deeper into data to explore the factors that contributed to the anomalies or trends. This could involve segmenting the data or looking at it from different perspectives.
Hypothesis Testing: Formulating hypotheses about what might be causing the trends or issues and testing these hypotheses through statistical methods.
Root Cause Analysis (RCA): Employing various RCA techniques to pinpoint the underlying causes of observed phenomena.
Techniques Used in Diagnostic Analytics
Drill-Down: Breaking down data into smaller segments to find the root causes of variations in the data.
Data Mining: Exploring large sets of data to find patterns and relationships.
Correlation Analysis: Identifying relationships between variables to see how they move in relation to one another.
Regression Analysis: Understanding the impact of variables on a particular outcome.
Multivariate Testing: Comparing data across multiple variables to see how they interact with each other.
Applications of Diagnostic Analytics
Marketing
Marketers use diagnostic analytics to understand the factors driving campaign performance. By analyzing customer behaviors, purchase patterns, and engagement metrics, companies can identify what elements of their campaigns are most effective and why certain strategies did not perform as expected.
Finance
In finance, diagnostic analytics can help identify the causes of budget variances or financial anomalies. For instance, if a company’s operational costs have significantly increased, diagnostic analytics can be used to drill down into various cost centers and uncover specific factors contributing to the increase.
Operations
Operations managers can use diagnostic analytics to improve process efficiencies and reduce waste. By examining production data, companies can find bottlenecks or inefficiencies in their manufacturing processes and understand the underlying reasons for operational delays or quality issues.
Healthcare
Healthcare providers utilize diagnostic analytics to improve patient care outcomes. By analyzing patient data, medical professionals can identify patterns related to adverse events, understand factors contributing to patient readmissions, and develop strategies to improve patient care.
2.3.6 Predictive Analytics
Predictive analytics encompasses a suite of statistical techniques and models that analyze historical and current data to make predictions about future events or behaviors.
This branch of analytics is fundamentally about forecasting and is instrumental in various sectors for identifying trends, understanding customer behavior, managing risks, and optimizing operational processes. It leverages techniques from data mining, statistics, modeling, machine learning, and artificial intelligence to analyze and interpret data, thereby forecasting future probabilities with an acceptable level of reliability.
Key Components of Predictive Analytics
Data Collection: The foundation of any predictive analytics effort is data. This can include historical data, real-time data streams, structured data (like sales figures), and unstructured data (like social media posts).
Data Analysis: Before predictive modeling, data needs to be cleaned and analyzed to identify patterns, trends, and anomalies. This stage often involves exploratory data analysis (EDA) and data visualization.
Statistical Modeling: Predictive analytics uses various statistical models depending on the nature of the prediction and the data. Common models include regression analysis (linear and logistic regression), time series analysis, and complex algorithms like neural networks.
Machine Learning: Many predictive analytics applications utilize machine learning algorithms to process large datasets and improve predictions over time as more data becomes available. Algorithms can range from simple decision trees to complex deep learning models.
Validation: Models are validated using techniques such as cross-validation to ensure their accuracy and reliability. This step is crucial for assessing how the model will perform on unseen data.
Deployment: Once validated, predictive models are deployed within business processes or decision-making tools to provide real-time predictions and insights.
Applications of Predictive Analytics
Financial Services
Credit Scoring: Banks and financial institutions use predictive analytics to assess the creditworthiness of loan applicants based on their historical financial data, transaction history, and other relevant factors.
Fraud Detection: Predictive models analyze transaction patterns to identify potentially fraudulent activities, significantly reducing losses due to fraud.
Healthcare
Disease Prediction: By analyzing patient data and medical histories, predictive analytics can identify individuals at risk of developing specific conditions, enabling preventative care measures.
Treatment Personalization: Predictive models help in tailoring treatment plans to individual patients based on their unique medical histories and genetic information.
Retail
Customer Lifetime Value Prediction: Retailers use predictive analytics to forecast the future value of customers, which informs marketing strategies and customer relationship management.
Inventory Management: Predictive models forecast demand for products, helping retailers optimize their inventory levels and reduce stockouts or overstock situations.
Manufacturing
Predictive Maintenance: By analyzing data from machinery sensors, predictive models can anticipate equipment failures before they happen, minimizing downtime and maintenance costs.
Supply Chain Optimization: Predictive analytics can forecast supply chain disruptions and demand fluctuations, enabling more efficient supply chain management.
Marketing
Customer Segmentation: Predictive analytics helps in segmenting customers based on predicted behaviors, preferences, and value, allowing for more targeted marketing campaigns.
Churn Prediction: Companies use predictive models to identify customers who are likely to churn, enabling proactive measures to retain them.
2.3.7 Prescriptive Analytics
Prescriptive analytics represents the cutting edge of business analytics, offering not just insights or forecasts but actionable recommendations designed to guide decision-making toward optimal outcomes.
It synthesizes information from descriptive and predictive analytics to suggest specific actions and consider the implications of each decision option. By employing advanced techniques like optimization, simulation, and machine learning, prescriptive analytics helps businesses not only to anticipate future trends but also to shape them.
How Prescriptive Analytics Works
Prescriptive analytics uses a combination of data, mathematical models, and computational algorithms to recommend actions. It often involves the following steps and components:
Data Collection: Gathering and integrating data from various sources, including historical data, transactional data, real-time data feeds, and big data.
Predictive Models: Building on predictive analytics to forecast future scenarios based on the data collected.
Decision Variables: Identifying and defining the variables that decision-makers can control.
Constraints: Recognizing any limitations or restrictions that might impact decision-making (e.g., budgetary, regulatory, capacity constraints).
Optimization Algorithms: Using mathematical optimization to find the best outcome from a set of potential outcomes, based on the objectives and constraints defined.
Simulation: Employing simulation models to explore the potential outcomes of different decision paths in a risk-free environment. This can include stochastic modeling to account for uncertainty and variability in predictions.
Machine Learning: Leveraging machine learning algorithms to improve the accuracy of predictions and the efficacy of recommendations over time, adapting to new data and outcomes.
Applications of Prescriptive Analytics
Prescriptive analytics finds applications across various industries, optimizing decision-making processes and enhancing operational efficiency. Some notable applications include:
Supply Chain Optimization
Prescriptive analytics can optimize supply chain operations by determining the most efficient inventory levels, production schedules, and distribution paths. It can suggest adjustments to minimize costs, meet delivery times, and respond to changing market demands or disruptions in the supply chain.
Financial Services
In banking and finance, prescriptive analytics helps in portfolio management by suggesting investment strategies that maximize returns while mitigating risks. It can also guide credit risk management by recommending credit limits and loan conditions tailored to individual customer profiles.
Healthcare
Prescriptive analytics aids healthcare providers in improving patient care through personalized treatment plans and preventive care recommendations. It can also optimize resource allocation, such as staffing levels and equipment utilization, to improve service delivery and reduce costs.
Energy Management
For utilities and energy companies, prescriptive analytics can forecast energy demand and recommend the most efficient energy production and distribution strategies. This includes optimizing the mix of energy sources, scheduling maintenance to avoid disruptions, and improving energy trading decisions.
2.3.8 Cognitive Analytics
Cognitive analytics is an advanced area of analytics that seeks to mimic human reasoning and thought processes in a computerized model. It leverages technologies such as artificial intelligence (AI), machine learning, natural language processing (NLP), and data mining to analyze large volumes of data in a way that mimics human understanding and insight. This approach allows businesses to process and interpret unstructured data, such as text, images, and voice, in a sophisticated manner that traditional analytics methods cannot achieve. Cognitive analytics systems learn and evolve based on the information they process, continually improving and providing deeper insights over time.
Key Features of Cognitive Analytics
Learning Capability: Unlike traditional analytics tools that follow predefined rules and algorithms, cognitive analytics systems learn from data patterns and human interactions, allowing them to adapt and make predictions or recommendations.
Natural Language Processing (NLP): These systems can understand and interpret human language, enabling them to analyze text data from various sources like emails, social media, and webpages.
Machine Learning: Through machine learning, cognitive analytics systems can improve their accuracy and efficiency as they process more data, identifying patterns and insights that were previously unnoticed.
Data Mining: Cognitive analytics applies advanced data mining techniques to uncover relationships, patterns, and trends from vast and complex datasets.
Applications of Cognitive Analytics
The applications of cognitive analytics are diverse and impactful across various sectors:
1. Healthcare
Personalized Medicine: By analyzing patient data and medical literature, cognitive analytics can help in creating personalized treatment plans that consider the patient’s unique health profile.
Disease Prediction and Prevention: These systems can predict disease outbreaks and progression by analyzing patterns in health data, enabling preventative measures or early interventions.
2. Customer Service
Chatbots and Virtual Assistants: Cognitive analytics powers sophisticated chatbots and virtual assistants that can understand and respond to customer queries in a natural, human-like manner, improving customer service and engagement.
Personalized Recommendations: E-commerce platforms use cognitive analytics to analyze customer behavior and preferences to make personalized product recommendations.
3. Financial Services
Fraud Detection: By analyzing transaction patterns and customer behavior, cognitive analytics can identify anomalies that may indicate fraudulent activity, enhancing security and reducing losses.
Risk Management: These systems can assess and predict various financial risks by analyzing market data, helping companies to make informed decisions.
4. Marketing
Consumer Insight: Cognitive analytics can process and analyze consumer data from social media, reviews, and feedback to gain insights into consumer behavior and preferences, informing targeted marketing strategies.
Campaign Optimization: By analyzing the effectiveness of different marketing channels and strategies, businesses can optimize their campaigns for better engagement and ROI.
5. Supply Chain Management
Predictive Maintenance: Analyzing data from equipment and sensors, cognitive analytics can predict when machines are likely to fail, scheduling maintenance before costly breakdowns occur.
Inventory Optimization: By analyzing sales data, market trends, and supply chain constraints, these systems can optimize inventory levels, reducing costs and improving efficiency.
2.4Statistical Learning
Statistical learning is a framework for understanding and modeling the relationships between variables using statistical methods. It forms the foundation for many predictive and inferential techniques used in data science and machine learning.
2.4.1 Key Concepts in Statistical Learning
Definition: Statistical learning is the process of using statistical models to estimate the underlying structure in data.
Objective:
To understand the relationship between input variables (predictors) and output variables (responses).
To make predictions or infer meaningful patterns from data.
Types of Statistical Learning:
Parametric Methods: Assume a specific form for the relationship between predictors and responses.
Examples: Linear regression, logistic regression.
Non-Parametric Methods: Do not assume a specific functional form, offering greater flexibility.
Examples: K-nearest neighbors, decision trees.
2.4.2 Applications of Statistical Learning
Agribusiness:
Predicting crop yields based on soil and weather conditions.
Analyzing market trends to determine optimal pricing strategies.
Healthcare:
Estimating disease risk based on patient demographics.
Analyzing the effectiveness of treatment methods.
Finance:
Credit scoring and risk analysis.
Portfolio optimization based on market trends.
Marketing:
Identifying customer segments for targeted advertising.
Predicting customer churn rates.
2.4.3 Common Techniques in Statistical Learning
Regression Analysis:
Linear regression, logistic regression, polynomial regression.
Classification Techniques:
Discriminant analysis, support vector machines.
Model Evaluation:
Cross-validation, hypothesis testing, and goodness-of-fit metrics.
Importance of Statistical Learning
Provides a theoretical basis for interpreting data-driven insights.
Helps in constructing accurate predictive models.
Enhances the understanding of relationships and patterns in data.
2.5Machine Learning
Machine learning builds upon statistical learning and focuses on creating algorithms that learn patterns from data and make predictions or decisions without being explicitly programmed.
2.5.1 Key Concepts in Machine Learning
Machine learning involves designing and training models that enable systems to improve performance as they are exposed to more data.
Reinforcement Learning: Learning by interacting with the environment to achieve a goal.
Examples: Autonomous drones for crop monitoring.
2.5.2 Applications of Machine Learning
Agribusiness:
Automated pest detection using image recognition.
Predictive models for crop rotation strategies.
Healthcare:
Diagnosing diseases with medical imaging.
Predicting patient outcomes using historical data.
Retail:
Recommendation systems for personalized shopping.
Optimizing inventory levels with predictive analytics.
Transportation:
Traffic management with real-time data.
Autonomous vehicle navigation.
2.5.3 Common Machine Learning Algorithms
Regression: Linear, logistic.
Decision Trees and Random Forests.
Neural Networks and Deep Learning.
Clustering: K-means, hierarchical clustering.
Support Vector Machines and Ensemble Methods.
2.5.4 Statistical Learning vs. Machine Learning
Aspect
Statistical Learning
Machine Learning
Focus
Inference
Prediction
Data Size
Small to medium datasets
Large and complex datasets
Techniques
Parametric and non-parametric
Neural networks, deep learning
Application
Traditional analytics
Automation and AI
2.6Artificial Intelligence
Artificial Intelligence (AI) is revolutionizing the agriculture sector by enabling smarter and more efficient farming practices. In agribusiness, AI refers to the application of intelligent systems to optimize agricultural processes, improve decision-making, and address challenges such as food security and sustainability.
2.6.1 Key Concepts in Artificial Intelligence
AI involves creating intelligent systems capable of analyzing data, learning from it, and making decisions to optimize agribusiness operations.
Types of AI:
Narrow AI:
Focused on specific tasks in agriculture.
Examples: AI-driven pest detection systems and crop monitoring tools.
General AI:
Aimed at handling multiple tasks (future potential in agribusiness).
Super AI:
A theoretical concept surpassing human intelligence.
Core Areas of AI in Agribusiness:
Machine Learning: Helps in analyzing weather patterns, crop health, and yield predictions.
Computer Vision: Enables detection of pests, diseases, and weeds through drones and cameras.
Robotics: Automates planting, harvesting, and irrigation tasks.
Natural Language Processing (NLP): Facilitates communication between farmers and AI systems for better usability.
2.6.2 Applications of Artificial Intelligence in Agribusiness
Precision Farming:
AI systems analyze soil health and recommend precise amounts of fertilizers and pesticides.
Drones equipped with AI survey fields to monitor crop growth and identify problem areas.
Livestock Management:
AI monitors the health and productivity of livestock through sensors and cameras.
Predictive analytics optimize feeding schedules and disease prevention.
Supply Chain Optimization:
AI improves logistics by predicting demand, optimizing routes, and reducing food wastage.
Real-time monitoring ensures the freshness of perishable goods.
Pest and Disease Management:
AI-powered systems detect pest infestations early and recommend control measures.
Machine learning models predict disease outbreaks based on weather and crop data.
Crop Yield Prediction:
AI uses historical data and real-time inputs to forecast yields, helping farmers make informed decisions.
Climate Adaptation:
AI predicts weather patterns, helping farmers prepare for extreme weather events.
Recommends crop varieties suitable for changing climatic conditions.
2.6.3 Benefits of Artificial Intelligence in Agribusiness
Increased Efficiency: AI optimizes resource use, reducing costs and environmental impact.
Enhanced Productivity: Enables data-driven decisions, resulting in higher yields.
Sustainability: Promotes eco-friendly farming practices through precision agriculture.
Risk Mitigation: AI forecasts market trends and weather, reducing uncertainties for farmers.
2.6.4 Challenges in Applying AI to Agribusiness
Data Limitations: Insufficient data from small-scale farmers hinders AI model training.
Cost of Implementation: High costs of AI technologies can be a barrier for smallholder farmers.
Infrastructure Issues: Limited access to the internet and electricity in rural areas poses challenges.
Ethical Concerns: Privacy issues related to data collection and use.
2.6.5 The Future of AI in Agribusiness
Artificial Intelligence is set to transform agribusiness by: - Enhancing food production to meet the demands of a growing population. - Promoting sustainable farming practices to combat climate change. - Revolutionizing the supply chain to minimize food loss and maximize efficiency.
2.7Data Mining
Data mining is a critical process in agribusiness, enabling the extraction of valuable insights from large datasets. It involves analyzing structured and unstructured data to uncover patterns, relationships, and trends that can drive informed decision-making in agriculture.
2.7.1 Key Concepts in Data Mining
Data mining refers to the process of discovering meaningful patterns, correlations, and anomalies in large datasets using statistical and computational methods.
Objectives of Data Mining in Agribusiness:
Improve crop yield predictions.
Optimize supply chain operations.
Enhance pest and disease management.
Forecast market trends for better pricing strategies.
Core Techniques:
Classification: Grouping data into predefined categories, such as identifying healthy and diseased crops.
Clustering: Organizing similar data points into clusters, like grouping farms based on soil types or climatic conditions.
Association Rule Learning: Identifying relationships between variables, such as the correlation between weather patterns and pest outbreaks.
Regression Analysis: Predicting outcomes like crop yields or livestock productivity.
Anomaly Detection: Spotting unusual events, such as sudden changes in soil conditions or weather patterns.
2.7.2 Applications of Data Mining in Agribusiness
Crop Management:
Analyzing historical and real-time data to recommend planting schedules and irrigation practices.
Identifying crops most suitable for specific soil and climate conditions.
Pest and Disease Detection:
Using data patterns to predict pest outbreaks and recommend preventive measures.
Monitoring satellite or drone data to identify affected regions.
Market Trend Analysis:
Mining consumer data to understand demand trends and optimize pricing strategies.
Forecasting market prices based on historical sales data.
Supply Chain Optimization:
Streamlining logistics by predicting demand and reducing wastage.
Enhancing inventory management using data-driven insights.
Livestock Management:
Monitoring livestock health and productivity through sensor data.
Identifying optimal feeding practices to maximize yield.
2.7.3 Benefits of Data Mining in Agribusiness
Enhanced Decision-Making: Data mining provides actionable insights, enabling farmers and agribusiness managers to make informed decisions.
Increased Efficiency: Optimizes resource allocation, reducing costs and environmental impact.
Risk Mitigation: Identifies potential risks, such as pest infestations or market downturns, allowing for proactive measures.
Improved Productivity: Enhances crop and livestock yields through data-driven strategies.
2.7.4 Challenges in Data Mining for Agribusiness
Data Quality: Inconsistent or incomplete data can affect the accuracy of results.
Data Access: Limited access to data in rural areas can be a barrier to effective data mining.
Technical Expertise: Requires skilled personnel to analyze and interpret data mining outputs.
Infrastructure Constraints: Inadequate technology and internet access can hinder data mining processes.
2.7.5 The Future of Data Mining in Agribusiness
As data availability and computational power grow, data mining will play an increasingly vital role in: - Developing precision agriculture practices. - Addressing global food security challenges. - Enhancing sustainability in farming. - Driving innovation in agribusiness decision-making.
Data mining, when integrated with advanced technologies like artificial intelligence and machine learning, holds the potential to transform the agricultural landscape.
2.8Difference Between Analysis and Analytics
The terms analysis and analytics are often used interchangeably, but they have distinct meanings, especially in the context of data-driven decision-making. Understanding the difference between the two is crucial for effectively leveraging data to achieve business goals.
2.8.1 Definition
Analysis:
Refers to the detailed examination or study of data to identify patterns, relationships, and insights.
It typically involves exploring historical data to answer the question, “What happened?”
Analytics:
Refers to the systematic computational analysis of data or statistics to discover meaningful patterns, trends, and insights.
It often uses tools, techniques, and algorithms to answer, “Why did it happen?” or “What will happen?”
2.8.2 Key Differences
Aspect
Analysis
Analytics
Focus
Understanding and summarizing past events.
Generating insights and predictions for future decisions.
Approach
Descriptive and diagnostic.
Predictive and prescriptive.
Scope
Narrow: Focused on specific problems or datasets.
Broader: Encompasses tools, methods, and processes.
To derive actionable insights and make predictions.
Time Orientation
Primarily past-oriented.
Focused on both past and future.
2.8.3 Examples
Agribusiness:
Analysis: Studying historical rainfall data to understand its correlation with crop yield.
Analytics: Using predictive models to forecast future rainfall and its potential impact on crop yield.
Retail:
Analysis: Analyzing past sales data to identify seasonal trends.
Analytics: Using predictive analytics to forecast sales for the upcoming season.
Healthcare:
Analysis: Reviewing patient data to identify common symptoms of a disease.
Analytics: Developing a model to predict the likelihood of disease occurrence in specific demographics.
Supply Chain:
Analysis: Examining past delivery delays to find bottlenecks.
Analytics: Optimizing logistics routes using advanced simulations.
2.8.4 Interconnection
Analysis serves as the foundation for analytics.
Without thorough analysis, analytics models may lack the necessary depth and understanding of data.
For example, identifying past patterns through analysis is essential before building predictive models in analytics.
2.8.5 Importance of Differentiating the Two
Strategy Development:
Businesses can use analysis to understand their past performance and analytics to create future strategies.
Skill Development:
Understanding the difference helps in aligning the right tools and techniques with organizational needs.
Resource Allocation:
Differentiating between analysis and analytics enables better allocation of resources, ensuring that both short-term and long-term goals are met.
2.9Difference Between Business Intelligence and Business Analytics
Business intelligence (BI) and business analytics (BA) are two essential components of modern data-driven organizations. While they share similarities in using data to support decision-making, their focus, purpose, and methodologies differ.
2.9.1 Definition
Business Intelligence (BI):
Refers to the technologies, processes, and practices used to collect, integrate, and analyze historical data to support business decision-making.
BI focuses on answering, “What happened?” and “How did it happen?”
Business Analytics (BA):
Refers to the use of statistical methods, predictive models, and machine learning to analyze data and derive actionable insights for decision-making.
BA focuses on answering, “Why did it happen?” and “What will happen next?”
2.9.2 Key Differences
Aspect
Business Intelligence (BI)
Business Analytics (BA)
Focus
Reporting and monitoring past and current data.
Analyzing data to predict and influence future outcomes.
Predictive models, statistical analysis, and machine learning tools.
Techniques
Data aggregation, visualization, and reporting.
Statistical modeling, data mining, and simulations.
Use Cases
Monitoring key performance indicators (KPIs).
Developing strategies based on predictive trends.
Complexity
Less complex, focuses on straightforward data analysis.
More complex, involves advanced analytics and modeling.
2.9.3 Examples
Agribusiness:
BI: Monitoring fertilizer usage and crop yields through dashboards.
BA: Predicting optimal planting seasons based on climate data.
Retail:
BI: Analyzing sales performance across regions.
BA: Forecasting product demand for the next quarter.
Healthcare:
BI: Tracking patient recovery rates in different departments.
BA: Predicting disease outbreaks based on historical patient data.
Supply Chain:
BI: Monitoring delivery times and inventory levels.
BA: Optimizing supply chain routes using predictive analytics.
2.9.4 Interconnection Between BI and BA
BI lays the groundwork by providing clean, well-organized data for analysis.
BA builds upon BI by using this data to create actionable insights and predictive models.
For example:
BI helps identify that a region is experiencing declining sales.
BA analyzes the reasons behind the decline and predicts future sales trends.
2.9.5 Importance of Differentiating the Two
Strategic Planning:
BI helps organizations monitor performance, while BA drives future strategies.
Tool Selection:
Differentiating BI from BA ensures that businesses adopt the right tools for their specific needs.
Resource Allocation:
Understanding the distinction helps allocate resources effectively for both reporting and predictive capabilities.
While both BI and BA are integral to data-driven decision-making, their roles complement each other. BI focuses on monitoring and understanding past performance, while BA emphasizes predicting and shaping the future. Together, they empower businesses to make informed, strategic decisions.
2.10Typical Process of the Business Analytics Cycle
The business analytics cycle represents a structured approach to solving business problems through data-driven decision-making. It involves systematically gathering, processing, analyzing, and utilizing data to uncover insights that support informed actions.
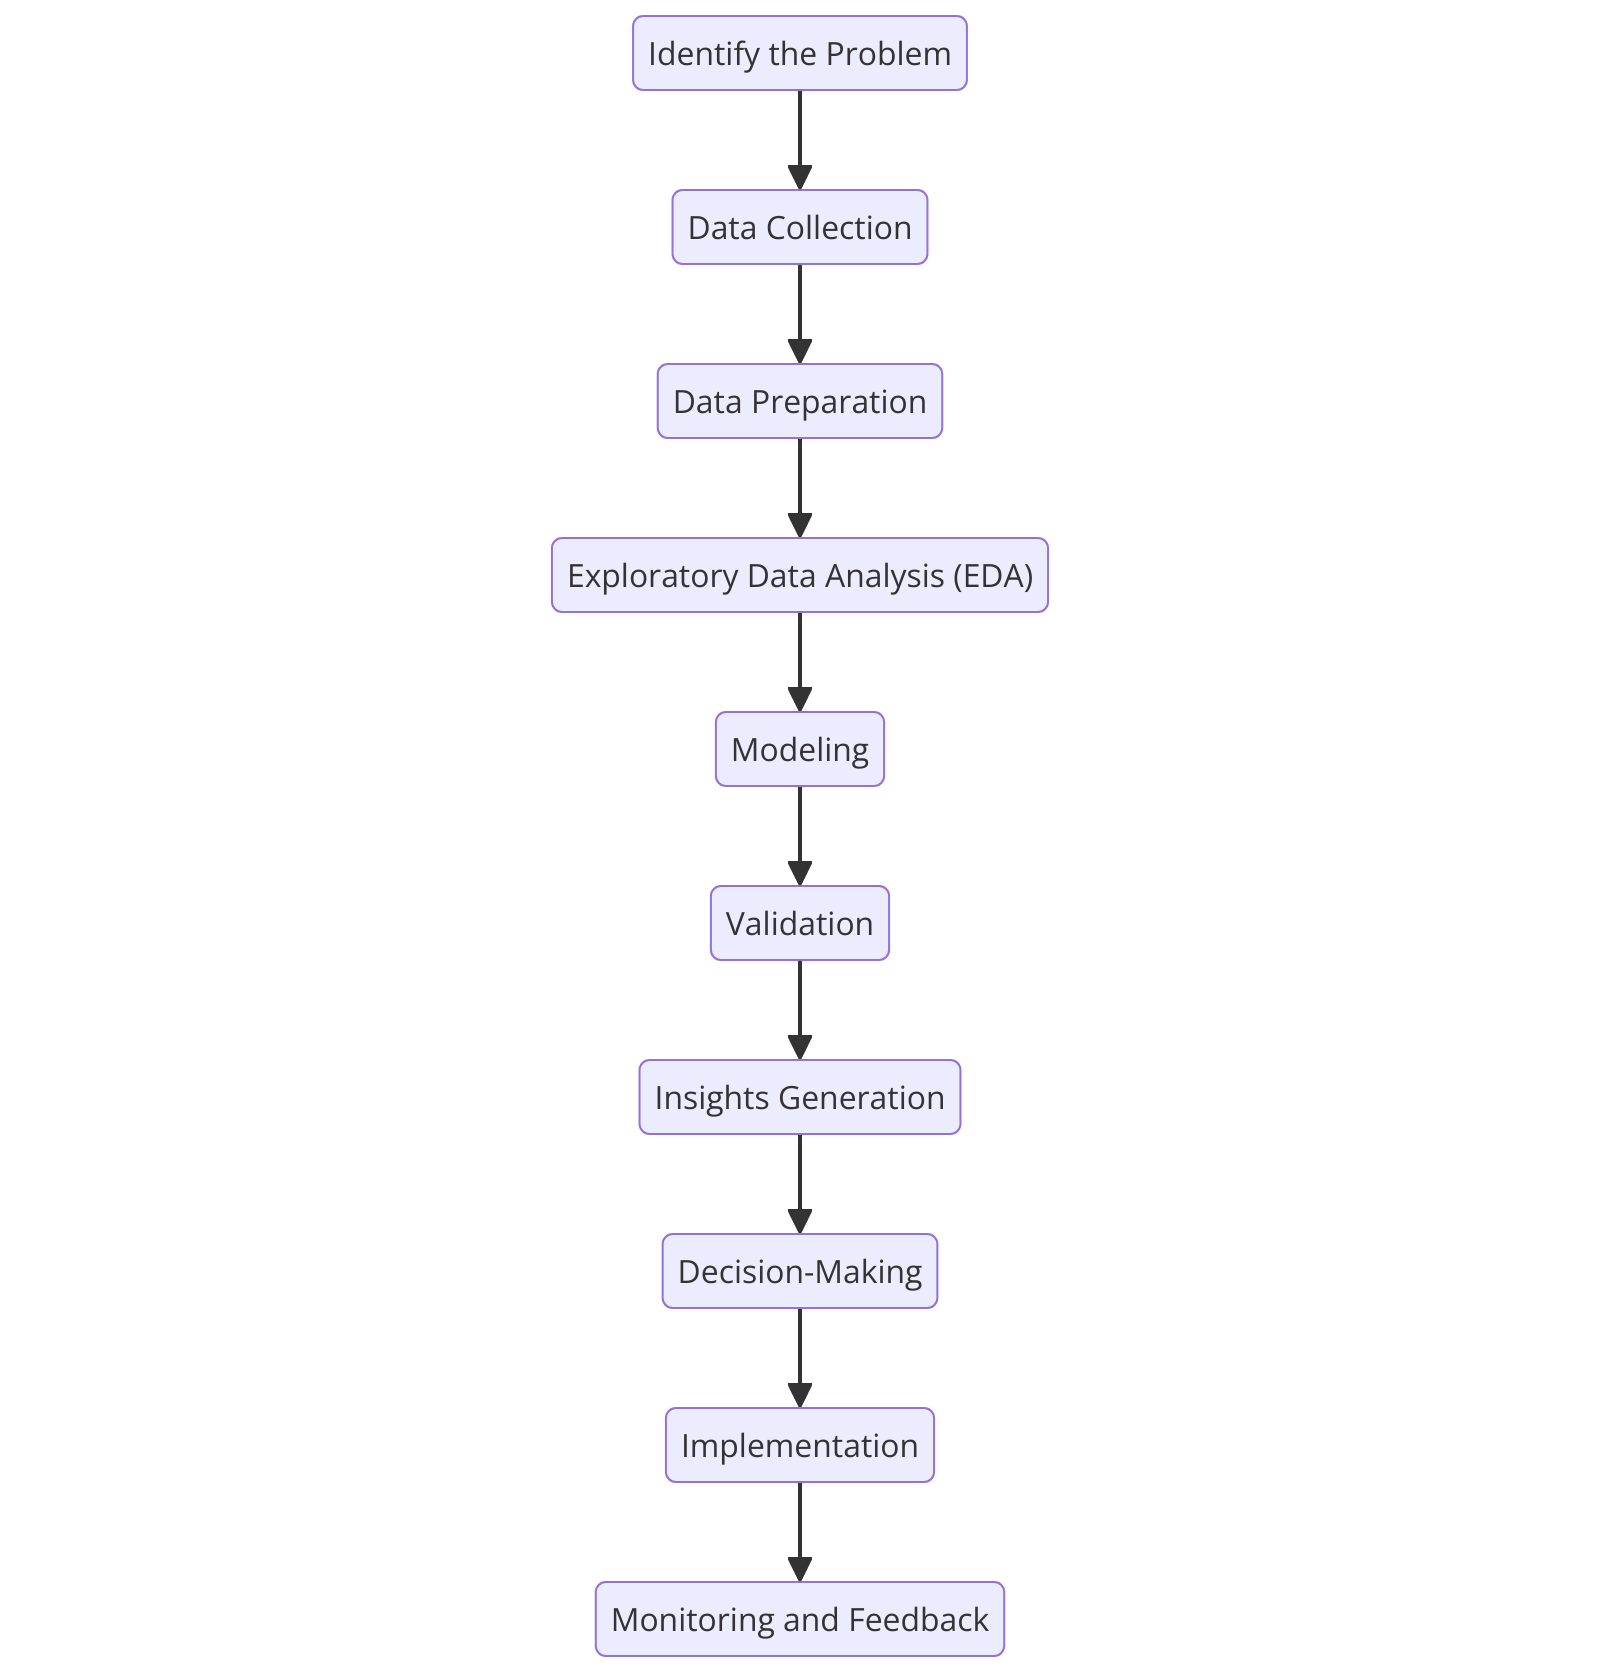
2.10.1 Stages of the Business Analytics Cycle
Business Analytics Cycle
Identify the Problem
Clearly define the business question or problem that needs to be addressed.
Example: What factors influence customer churn in an agribusiness supply chain?
Data Collection
Gather relevant data from various sources such as databases, surveys, IoT devices, or third-party providers.
Example: Collect soil quality, crop yield, and market demand data in agribusiness.
Data Preparation
Clean and preprocess the data to remove inconsistencies, handle missing values, and standardize formats.
Steps:
Data cleaning (removing duplicates, handling outliers).
Data transformation (normalization, encoding).
Feature selection (choosing relevant variables).
Exploratory Data Analysis (EDA)
Conduct initial analysis to uncover patterns, trends, and relationships in the data.
Tools: Visualization tools like Tableau, Power BI, or programming languages like R and Python.
Example: Analyze seasonal trends in crop yields.
Modeling
Apply statistical models and machine learning algorithms to analyze the data.
Types of Models:
Descriptive: Understand historical performance.
Predictive: Forecast future trends.
Prescriptive: Suggest optimal actions.
Example: Use regression analysis to predict sales or clustering to segment customers.
Validation
Assess the model’s accuracy and reliability using testing data and validation techniques like cross-validation.
Metrics:
Root Mean Squared Error (RMSE).
Mean Absolute Error (MAE).
Classification accuracy.
Insights Generation
Translate the model’s results into actionable business insights.
Create dashboards and reports for decision-makers.
Example: Recommend optimal fertilizer usage based on crop and soil data.
Decision-Making
Use insights to inform strategic and operational decisions.
Example: Adjust marketing strategies to target specific customer segments.
Implementation
Put the insights and decisions into action through operational changes or strategic initiatives.
Example: Implement automated irrigation systems based on predictive analytics.
Monitoring and Feedback
Continuously monitor the impact of implemented decisions and refine the analytics process based on new data.
Example: Track the effectiveness of crop rotation strategies and update models accordingly.
 1. Volume: Refers to the enormous size of data generated every second.
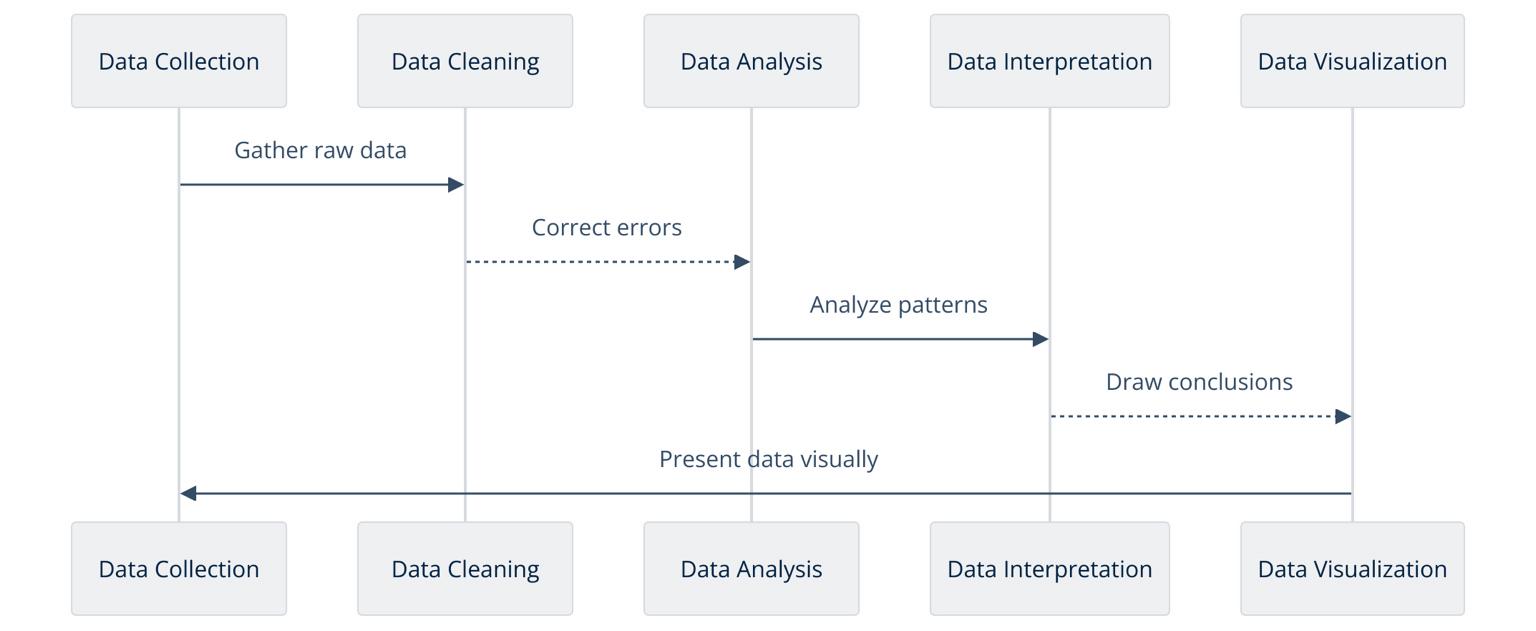
 source: