| Concept | Description |
|---|---|
| Business Analytics Foundations | |
| Analytics vs. Business Analytics | Analytics turns data into decision-ready insight; Business Analytics applies that process specifically to organizational data and performance. |
| Data Analytics and Its Components | Collecting, cleaning, analyzing, interpreting, and visualizing data, the five components of the data-analytics pipeline. |
| Data Analytics Tools and Technologies | Spans programming languages, visualization, data warehousing, Big Data platforms, BI tools, ML platforms, integration, and cloud. |
| Types of Business Analytics | Descriptive, diagnostic, predictive, prescriptive, and cognitive. Each answering a progressively harder question. |
| The Five Types of Analytics | |
| Descriptive Analytics | Summarizes what happened. Full statistical treatment lives in Topic 7. |
| Diagnostic Analytics | Explains why it happened, via drill-down, correlation, and root-cause analysis. |
| Predictive Analytics | Forecasts what will happen, via statistical modeling, machine learning, and validation. |
| Prescriptive Analytics | Recommends what to do about it, via optimization, simulation, and decision variables/constraints. |
| Cognitive Analytics | Mimics human reasoning over unstructured data. The layer generative AI and LLMs now make conversational. |
4 Business Analytics
Analytics is the scientific process of transforming data into insights for making better decisions, “the use of data, information technology, statistical analysis, quantitative methods, and mathematical or computer-based models to help managers gain improved insight about their business operations and make better, fact-based decisions” (evans?). Business Analytics (BA) is the methodical exploration of an organization’s data, with an emphasis on statistical analysis, used by organizations committed to data-driven decision-making. Its goal is to understand past performance and make informed predictions about future action. A farm cooperative reading last season’s yield data is analysis; building a model that recommends next season’s planting mix from it is analytics. This topic covers what Business Analytics is made of, then works through its five types in turn: descriptive, diagnostic, predictive, prescriptive, and cognitive.
4.1 Overview and Types
4.1.1 Data Analytics and Its Components
Data Analytics is the process of examining, cleaning, transforming, and modeling data to discover useful information, inform conclusions, and support decision-making. It’s a multifaceted field combining mathematics, statistics, computer science, and information technology.
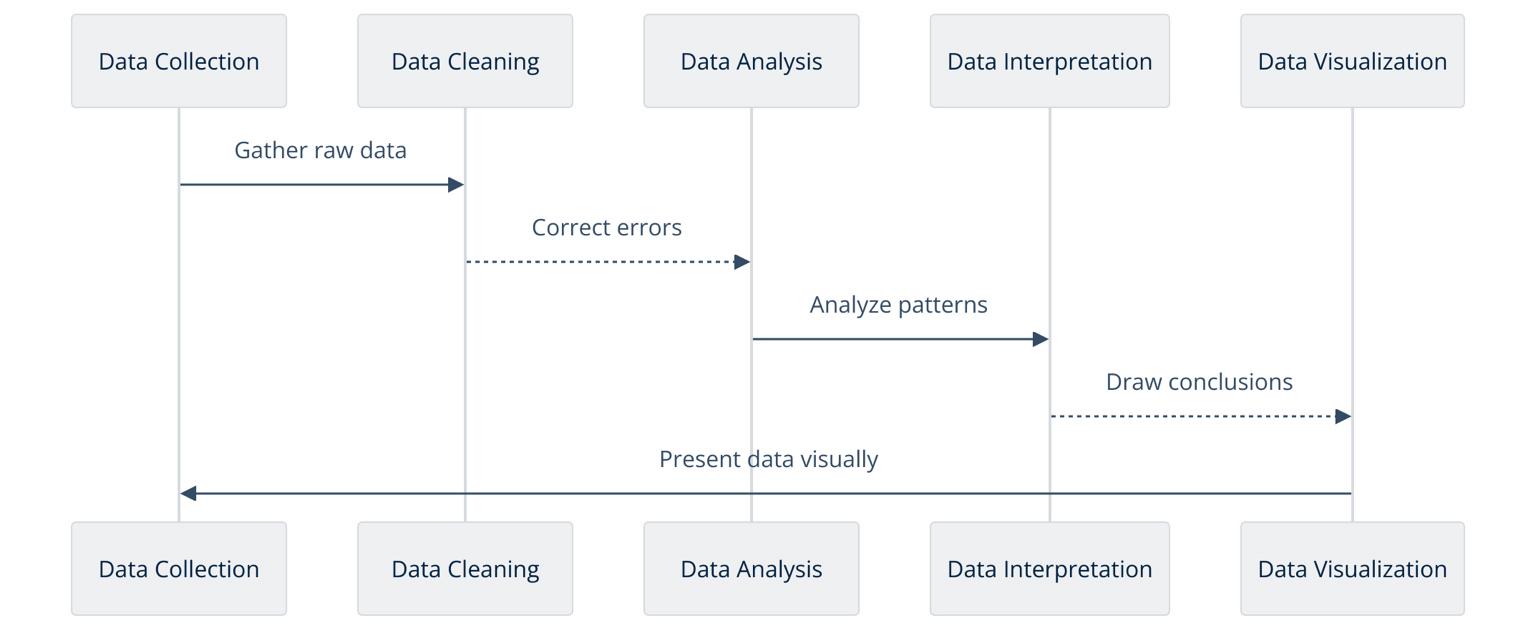
- Data collection, gathering raw data from databases, files, external services, or sensors (e.g. weather stations, soil probes).
- Data cleaning, identifying and correcting errors or inconsistencies to improve data quality.
- Data analysis, using statistical techniques and software to explore data, find patterns, relationships, or trends.
- Data interpretation, making sense of the analyzed data to draw meaningful conclusions.
- Data visualization, presenting data as charts, graphs, and dashboards for easier interpretation.
4.1.2 Data Analytics Tools and Technologies
| Category | Examples | Typical Role |
|---|---|---|
| Programming languages | Python, R, SQL | Python for its ML ecosystem (Pandas, scikit-learn, TensorFlow); R for statistics and visualization (ggplot2, dplyr); SQL for querying |
| Visualization | Tableau, Power BI | Interactive dashboards and reporting |
| Data warehousing | PostgreSQL, MongoDB, Amazon Redshift, Google BigQuery | Storing and querying structured and unstructured data at scale |
| Big Data platforms | Apache Hadoop, Apache Spark | Distributed storage and processing of very large datasets |
| BI tools | SAS, IBM Cognos, Google Looker Studio | Statistical, predictive, and descriptive reporting |
| Machine learning platforms | TensorFlow, PyTorch, RapidMiner, Google AI Platform, AWS Machine Learning | Building, training, and deploying ML and deep-learning models |
| Data integration and pipelines | Talend, Informatica, Apache Kafka | Combining sources into one pipeline; real-time streaming |
| Cloud platforms | AWS, Google Cloud, Microsoft Azure | Storage, compute, and managed ML services on demand |
4.1.3 Types of Business Analytics
Business analytics is generally divided into four types, plus a more recent fifth category (cognitive analytics) that layers AI on top of the other four. Each answers a different question and builds on the ones before it.

| Type | Question It Answers | Key Techniques | Agribusiness Example |
|---|---|---|---|
| Descriptive | What happened? | Data aggregation, dashboards, summary statistics | Season-end yield and rainfall reports |
| Diagnostic | Why did it happen? | Drill-down, correlation, root-cause analysis | Why did yield drop 15% in the eastern plots? |
| Predictive | What will happen? | Statistical models, machine learning, forecasting | Forecasting next season’s yield from weather and soil data |
| Prescriptive | What should we do about it? | Optimization, simulation | Recommending planting dates and fertilizer mix to maximize yield |
| Cognitive | How can the system reason like an expert? | AI, NLP, machine learning | An AI advisory chatbot answering a farmer’s irrigation question in plain language |
The rest of this topic works through each of these five types in turn.
4.2 Descriptive Analytics
Descriptive analytics is the examination of historical data to understand what has already happened in a business, or on a farm. By summarizing past events and performance, it helps organizations spot trends and understand the reasons behind success or failure. It’s usually the first step in the broader analytics taxonomy, laying the groundwork for diagnostic, predictive, and prescriptive analysis, which is why it’s covered on its own in Topic 7. Descriptive Analytics later in this unit, with the full statistical toolkit (central tendency, dispersion, distribution, association).
4.2.1 What It Covers, in Brief
- Data aggregation and summarization, compiling reports, dashboards, and visualizations from raw records.
- Trend analysis, spotting consistent patterns over time, such as a multi-season decline in a region’s average yield.
- Visualization, presenting findings as charts, graphs, and heat maps so stakeholders can grasp them quickly.
4.2.2 Where It Shows Up in Agribusiness
- Yield and input reporting. Season-end summaries of yield, rainfall, and fertilizer use by field or region.
- Cost and margin tracking. Average cost per hectare, revenue per tonne, by crop and season.
- Herd or flock performance, summarizing livestock weight gain, feed conversion, and mortality over a production cycle.
For the actual statistics behind descriptive analytics (measures of central tendency, dispersion, skewness, kurtosis, and association, each with worked agribusiness examples) see Topic 7, Descriptive Analytics.
4.3 Diagnostic Analytics
Diagnostic analytics goes a step further than descriptive analytics: instead of just describing what happened, it investigates why it happened. It drills into data, discovers patterns, identifies anomalies, and investigates the causes behind observed events, essentially, finding the relationships among data points that explain a particular outcome.
4.3.1 How Diagnostic Analytics Works
- Data collection and preparation, gathering comprehensive data from various sources and cleaning it for analysis.
- Identification of anomalies, flagging deviations from the norm that merit further investigation.
- Drill-down analysis, segmenting the data or viewing it from different angles to isolate contributing factors.
- Hypothesis testing, formulating and statistically testing explanations for the trend or issue.
- Root-cause analysis (RCA), pinning down the underlying cause of the observed pattern.
4.3.2 Techniques Used
- Drill-down, breaking data into smaller segments to find the root cause of variation.
- Correlation analysis, identifying relationships between variables.
- Regression analysis, understanding how variables influence a particular outcome.
- Multivariate testing, comparing data across multiple variables to see how they interact.
4.3.3 Diagnostic Analytics in Practice
- Agribusiness, a cooperative sees yield fall 15% in its eastern plots; diagnostic analytics drills into soil-test, rainfall, and input-application records for those specific plots to isolate whether the cause was a late monsoon, an under-applied fertilizer batch, or a pest outbreak, rather than a region-wide problem.
- Marketing, understanding which elements of a campaign drove (or failed to drive) engagement.
- Finance, drilling into cost centers to uncover the specific driver behind a budget variance.
- Operations, finding the bottleneck behind a production delay or quality issue.
- Healthcare, identifying factors behind patient readmissions.
4.4 Predictive Analytics
Predictive analytics uses statistical techniques and models to analyze historical and current data in order to forecast future events or behaviors. It draws on data mining, statistics, modeling, machine learning, and AI to identify trends, understand behavior, manage risk, and optimize operations, forecasting future outcomes with an acceptable level of reliability rather than certainty.
4.4.1 Key Components
- Data collection. Historical records, real-time streams, structured data (e.g. yield logs), and unstructured data (e.g. drone imagery).
- Data analysis. Exploratory analysis and visualization to identify patterns before modeling.
- Statistical modeling. Regression (linear and logistic), time-series analysis, and more complex models such as neural networks.
- Machine learning. Algorithms that improve predictions as more data becomes available, from simple decision trees to deep learning.
- Validation, testing accuracy and reliability with techniques such as cross-validation, before trusting a model’s forecast.
- Deployment, putting a validated model into a business process so it produces real-time predictions.
4.4.2 Predictive Analytics in Practice
- Agribusiness, forecasting next season’s yield from weather, soil, and satellite data; predicting the onset of a pest outbreak from temperature and humidity trends before it’s visible in the field; forecasting commodity-price movement to inform when to sell stored grain.
- Financial services. Credit scoring and fraud detection from transaction patterns.
- Healthcare. Disease-risk prediction and treatment personalization from patient history.
- Retail. Customer lifetime value and demand forecasting for inventory planning.
- Manufacturing. Predictive maintenance that flags equipment likely to fail before it does.
- Marketing. Churn prediction that flags customers likely to leave before they do.
4.5 Prescriptive Analytics
Prescriptive analytics goes beyond insight or forecast to offer actionable recommendations for reaching an optimal outcome. It synthesizes descriptive and predictive analytics, then uses optimization, simulation, and machine learning to suggest specific actions and weigh the consequences of each option, helping a business not just anticipate the future, but shape it.
4.5.1 How Prescriptive Analytics Works
- Data collection, integrating historical, transactional, and real-time data.
- Predictive models, forecasting future scenarios from the collected data.
- Decision variables, identifying what decision-makers can actually control (e.g. planting date, fertilizer quantity).
- Constraints, recognizing limits on the decision (budget, water availability, regulatory limits).
- Optimization algorithms, finding the best outcome given the objectives and constraints.
- Simulation, exploring the consequences of different decisions in a risk-free environment, often accounting for uncertainty (e.g. a range of possible rainfall outcomes).
- Machine learning, improving the accuracy of recommendations over time as new outcomes are observed.
4.5.2 Prescriptive Analytics in Practice
- Agribusiness, recommending the planting date, seed variety, and fertilizer mix that maximizes expected yield under a given field’s soil and water constraints; optimizing harvest and transport scheduling across multiple fields to minimize spoilage.
- Supply chain, determining efficient inventory levels, production schedules, and distribution routes.
- Financial services, recommending investment strategies and credit terms tailored to a customer’s risk profile.
- Healthcare, recommending personalized treatment plans and optimal staffing levels.
- Energy management, recommending the most efficient mix and scheduling of energy production and distribution.
4.6 Cognitive Analytics
Cognitive analytics is the most advanced layer of the analytics taxonomy: it seeks to mimic human reasoning in a computerized model, using AI, machine learning, natural language processing (NLP), and data mining to interpret unstructured data (text, images, and voice) in ways traditional analytics can’t. Cognitive analytics systems learn and evolve as they process more information, continually improving their insight. In 2026, the most visible form of this is the generative-AI and LLM-based advisory tool: a system a farmer or extension worker can simply ask a question of, in plain language, and get a grounded answer back. The same underlying idea this section describes, now made conversational (see Artificial Intelligence for more on generative AI specifically).
4.6.1 Key Features
- Learning capability. Unlike rule-based tools, cognitive systems learn from data patterns and human interaction, adapting their predictions and recommendations.
- Natural language processing (NLP), understanding and interpreting human language from text sources such as emails, reports, or field notes.
- Machine learning, improving accuracy and efficiency as more data is processed.
- Data mining, uncovering relationships, patterns, and trends from large, complex datasets.
4.6.2 Cognitive Analytics in Practice
- Agribusiness. An AI-assisted advisory chatbot that answers “should I irrigate this week?” in plain language, grounded in that specific field’s own sensor and weather history; NLP-based analysis of extension-agent field notes to spot recurring disease reports across a region before they’re formally reported.
- Healthcare. Personalized treatment recommendations and disease-progression prediction from patient data and medical literature.
- Customer service. Chatbots and virtual assistants that understand and respond to queries in natural language.
- Financial services. Fraud detection and risk assessment from transaction patterns and market data.
- Marketing. Consumer-insight extraction from social media, reviews, and feedback.
- Supply chain. Predictive maintenance and inventory optimization from equipment and sales data.